Sponsored by:

EXECUTIVE SUMMARY

IEEE 1584-2002 Arc-Flash Study

Good Enough for a Post IEEE 1584-2018 Risk Assessment?

  • The IEEE 1584-2018 guide raises risk analysis questions for organizations.
  • IEEE 1584-2018 calculates the impact of arc-flash differently than the 2002 version.
  • New variables in IEEE 1584-2018 arc-flash studies affect arcing current calculations and protective device response time.
  • Time is an important factor when it comes to incident energy.
  • The constant energy boundary is a tool that organizations can use to evaluate whether their previous PPE choices are adequate considering what a 2018 study might predict.
  • This analysis may clarify whether existing PPE selections are adequate or whether more attention is required.
IEEE 1584-2018 (IEEE Guide for Performing Arc-Flash Calculations) is substantially different from and more accurate than the 2002 version of this guide.
Many organizations are now wondering whether PPE selections based on IEEE 1584-2002 arc-flash studies are still safe for workers. In some cases, incident energy levels calculated with the 2002 model and the 2018 model are different by more than a factor of two. Fortunately, organizations can evaluate their concerns about PPE and worker risk with assessment methodologies that require only a few known variables. This analysis may clarify whether existing PPE practices are adequate or whether more attention is required.

Context

Marcelo Valdes shared a methodology he developed that organizations can use to assess whether PPE selections made based on IEEE 1584-2002 are still suitable, given the new approach to arc-flash calculations used in IEEE 1584-2018. The presentation was based on a paper presented at the IEEE 2020 Electrical Safety Workshop in March 2020.
Marcelo E. Valdes, P.E.
Application & Standards Engineering Manager, Marketing, ABB

Adapting IEEE 1584-2002 Arc Flash Study Results to a Post IEEE 1584-2018 Risk Assessment

This presentation is a based on a paper presented at the IEEE 2020 Electrical Safety Workshop in March 2020.

Download PDF

Adapting IEEE 1584-2002 Arc Flash Study Results to a Post IEEE 1584-2018 Risk Assessment

This presentation is a based on a paper presented at the IEEE 2020 Electrical Safety Workshop in March 2020.

Download PDF

Key Takeaways

The IEEE 1584-2018 guide raises risk analysis questions for organizations.
IEEE 1584 is the standard of care for predicting the impact of an electrical explosion, known as arc flash, on workers under a set of specific conditions. The 2002 version of this IEEE guide was revolutionary in its ability to quantify arcing current and incident thermal energy in a useful manner. Organizations used the data to properly set overcurrent protection and select PPE. In 2018, a newer and better version of this guide was published: IEEE 1584-2018.

IEEE 1584-2018 is prompting organizations to reconsider their old arc-flash studies and PPE selections. Common questions include:

Old Arc-Flash Studies

What should organizations do with their old arc-flash studies and PPE selections?

Continued Use of 2002 Arc-Flash

Is it ok to continue using 2002 arc-flash studies and PPE selections until the organization conducts a 2018 arc-flash study?

Ignoring
IEEE 1584-2018

What are the risk assessment and control implications of ignoring IEEE 1584-2018?

Adequate PPE
for Workers

Based on the new science, do workers have adequate PPE for the potential severity of an arc-flash event?

Although IEEE 1584-2018 may raise legal and regulatory compliance concerns for organizations, it also should raise concerns regarding risk analysis for specific work tasks that may need to be accomplished.
In recent years, many employers have been implementing risk-based workplace injury and illness prevention programs, to better meet OSHA requirements. Risk management in the NFPA 70E standard focuses on monitoring and reviewing risks. A central part of risk management is a risk assessment that analyzes risk sources to estimate overall risk level. A risk level includes the potential that a dangerous event will occur and the potential severity of that event. These two factors must be considered together. Based on the risk level, organizations determine how to control the risk.
According to NFPA 70E, a Risk Analysis Has the Following Characteristics
Systematic, Structured, and Timely
Based on the Best Available Information
Dynamic, Interative, and Responsive to Change
Systematic, Structured, and Timely
Based on the Best Available Information
Dynamic, Interative, and Responsive to Change
Systematic, Structured, and Timely
Based on the Best Available Information
Dynamic, Interative, and Responsive to Change
IEEE 1584-2018 calculates the impact of arc-flash differently than the 2002 version.
IEEE 1584-2018 is more accurate than IEEE 1584-2002. It is based on thousands of tests, rather than hundreds. It was also created in a more scientific way with multiple variables. Two major differences between IEEE 1584- 2018 and IEEE 1584-2002 are:
1
Electrode configuration and arc environment.
These parameters were not considered in IEEE 1584-2002. In the old model, all input data was based on arc-flash conductors being vertical or parallel to the workers (referred to as VCB). The 2018 standard also considers horizontal or perpendicular orientations (referred to as HCB) and vertical or parallel into barrier orientations (referred to as VCBB).
2002 & 2018
2018
2018
Figure 1: Electrode Configurations and Arc Environment
2
Gap and Closure.
These are now two expanded variables in IEEE 1584-2018. Changes to the gap and enclosure parameters will affect arc-flash calculations. In most cases, however, organizations continue to use the gap and enclosure values suggested as typical by the IEEE guide. Those values did not change between the 2002 and 2018 versions.
Parameter
2002 Model
Voltage (VoC)
208 - 600 V & 1kV - 13.8kV
Frequency
50 - 60Hz
Current @ LV (lbf)
700A - 106kA
Current @MV (lbf)
700A - 63kA
Gap (G) @ LV
10 - 40mm
Gap (G) @ MV
13 - 152mm
Working Distance (D)
Typically 15 - 36 inches
System Grounding
Used
Enclosure
Assumed per voltage & gap
Electrode Configurations
VCB, VOA (vertical only)
Parameter
2002 Model
2018 Model
Voltage (VoC)
208 - 600 V & 1kV - 13.8kV
208V - 15kV
Frequency
50 - 60Hz
50 - 60Hz
Current @ LV (lbf)
700A - 106kA
≤ 600V→500A - 106kA
Current @MV (lbf)
700A - 63kA
> 600V→200A - 65kA
Gap (G) @ LV
10 - 40mm
≤ 600V→6.35A - 76.2mm
Gap (G) @ MV
13 - 152mm
> 600V→19.05 - 254mm
Working Distance (D)
Typically 15 - 36 inches
≤ 12 inches
System Grounding
Used
Ignored
Enclosure
Assumed per voltage & gap
variable, 49" maximum for any 1 dimension
Electrode Configurations
VCB, VOA (vertical only)
VCB, VOA+ VCBB, HCB & HOA
Parameter
2018 Model
Voltage (VoC)
208V - 15kV
Frequency
50 - 60Hz
Current @ LV (lbf)
≤ 600V→500A - 106kA
Current @MV (lbf)
> 600V→200A - 65kA
Gap (G) @ LV
≤ 600V→6.35A - 76.2mm
Gap (G) @ MV
> 600V→19.05 - 254mm
Working Distance (D)
≤ 12 inches
System Grounding
Ignored
Enclosure
variable, 49" maximum for any 1 dimension
Electrode Configurations
VCB, VOA+ VCBB, HCB & HOA
Figure 2: Parameters for IEE 1584-2002 vs. IEEE 1584-2018
“The electrode orientation is the variable with the greatest impact on 2018 versus 2002 arc-flash study calculations.”
— Marcelo E. Valdes, ABB
New variables in IEEE 1584-2018 arc-flash studies affect arcing current calculations and protective device response time.
In 2002 arc-flash studies, VCB was the only electrode orientation and the enclosure was always standard. In 2018 arc-flash studies, however, electrode configuration has become a big factor. Although gap and enclosure size are also variables, those are less likely to change. Electrode configuration, however, affects arcing current (Iarc) and incident energy (Ei) directly. Organizations must keep the following points in mind when conducting 2018 arc-flash studies:
If you are unsure about the size of the gap, use a larger one to be conservative. In most cases, organizations use the same gap in 2018 arc-flash studies as in prior 2002 studies. If the organization decides that a larger gap is needed, it is important to recognize this will result in less arcing current, which is harder to detect, and also results in more energy per unit of time, which is potentially a more hazardous situation. If the gap is smaller or the same, organizations can ignore its impact on the suggested analysis.
Generally speaking, the 2018 arcing current predicted is higher than the 2002 calculations would have predicted. This is true for VCB, HCB, and VCBB electrode orientations. Higher arcing current will engender faster or equal protection time from the overcurrent protective device, but it should never cause slower protection. With very high fault current, the arcing current in the 2018 model may be lower than the 2002 model would have predicted. This occurs at currents that aren’t commonly found in real-world commercial and industrial systems. Most industrial commercial systems tend to be 55kA and below.
Figure 3: The impact of Gap on Arcing Current at 480V
Figure 4: The impact of Gap on Arcing Current at 208V
With 208 volts, a 25-millimeter gap, and a standard low-voltage box, the arcing current values are higher than the 2002 model, but they flatten out (see Figure 4) at higher available fault current. When calculating an arc-flash for very high fault current systems, the overcurrent protection may act substantially differently than expected. In the middle range, however, the 2018 model will produce higher arcing currents than the 2002 model for almost all voltages and gaps and hence the protection can be expected to be faster, or at worst case the same speed as for the 2002 calculated arcing current.
Figure 4: The impact of Gap on Arcing Current at 208V
When comparing 2002 and 2018 arc-flash studies, protective devices will clear at the same time or faster, never slower. When looking at protective devices like circuit breakers or fuses, the circuit breaker and fuse time current curves are steeper than the constant energy boundary (see Figure 5). When arcing current is higher, protection devices will clear faster. If protection hits the horizontal portions of the circuit breaker time current curve, it will be the same speed. Without looking at the time current curve or knowing the exact value of the arcing current, it is evident that protective devices will clear at the same time or faster, never slower.
Figure 5: The impact of Increasing Arcing Current on Protective Devices
Time is an important factor when it comes to incident energy.
For VCBB and VCB electrode orientations, the 2002 model may be adequate or even conservative over a wide range of situations. However, that is not always the case. For HCB electrode orientations, the 2018 model indicates more incident energy in all scenarios than the 2002 model.
Figure 6: Incident Energy Calculations Using the 2002 and 2018 Models
Time is a very important factor for incident energy. Arcing current decreases as gap dimensions increase. Lower arcing current is harder to detect and protection may slow. Incident energy, however, increases as gap dimensions increase because the arc is longer. Although the effects may be small, they can add up—especially if protection slows.
The constant energy boundary is a tool that organizations can use to evaluate whether their previous PPE choices are adequate.
When people don’t have exact values of bolted fault currents, they sometimes use a tool for arc-flash analysis called the constant energy boundary. For any one value of arcing current, the constant energy boundary shows the time needed to produce a specific value of incident energy. For the same incident energy target, the IEEE 1584-2018 model allows more time at the same value of arcing current than the IEEE 1584-2002 model. The challenge in using the chart in Figure 7, however, is that one must know the exact arcing current.
Figure 7: Constant Energy Boundary -  A Tool
Figure 8: Transposing Arcing Current to Bolted Fault Current
The solution to this issue is to transpose the clearing time from arcing current to bolted fault current. The bolted fault current is known to most organizations. If systems haven’t changed since the last time an organization conducted an arc-flash study, the bolted fault current values shown in the 2002 arc-flash study should still be accurate. The new IEEE 1584-2018 arc-flash calculations haven’t changed the way bolted fault current is derived.

In the region between the two vertical black lines in Figure 8, the data is comparable. The vertical lines bound the range of bolted fault current where the 2018 arcing current will be larger than the 2002 arcing current calculations. One can assume that the time, gap, working distance, and enclosure variables are the same. Therefore, from the graph before, since we know the OPCD protected at the black line or faster, the incident energy for VCB exposure predicted with the 2018 model will be less.
Figure 8: Transposing Arcing Current to Bolted Fault Current

As shown in Figure 9, for VCBB, the incident energy depends on the exact bolted fault current. And for HCB, it is always worse. However, this assumes that the incident energy target performance is the same for the 2002 and the 2018 arc-flash studies.


In reality, there is a high likelihood that 2002 arc-flash studies resulted in PPE selections that could accommodate more incident energy than the actual exposure. Usually the PPE level selected or recommended is greater than the calculated incident energy. Typical values of PPE may be 8, 25, or 40 calories. The open question is whether the margin is big enough to cover the difference between the 2002 arc-flash calculations and what calculations using the new 2018 model would predict. As outlined in Figure 10, using the right graphs can help answer this question.
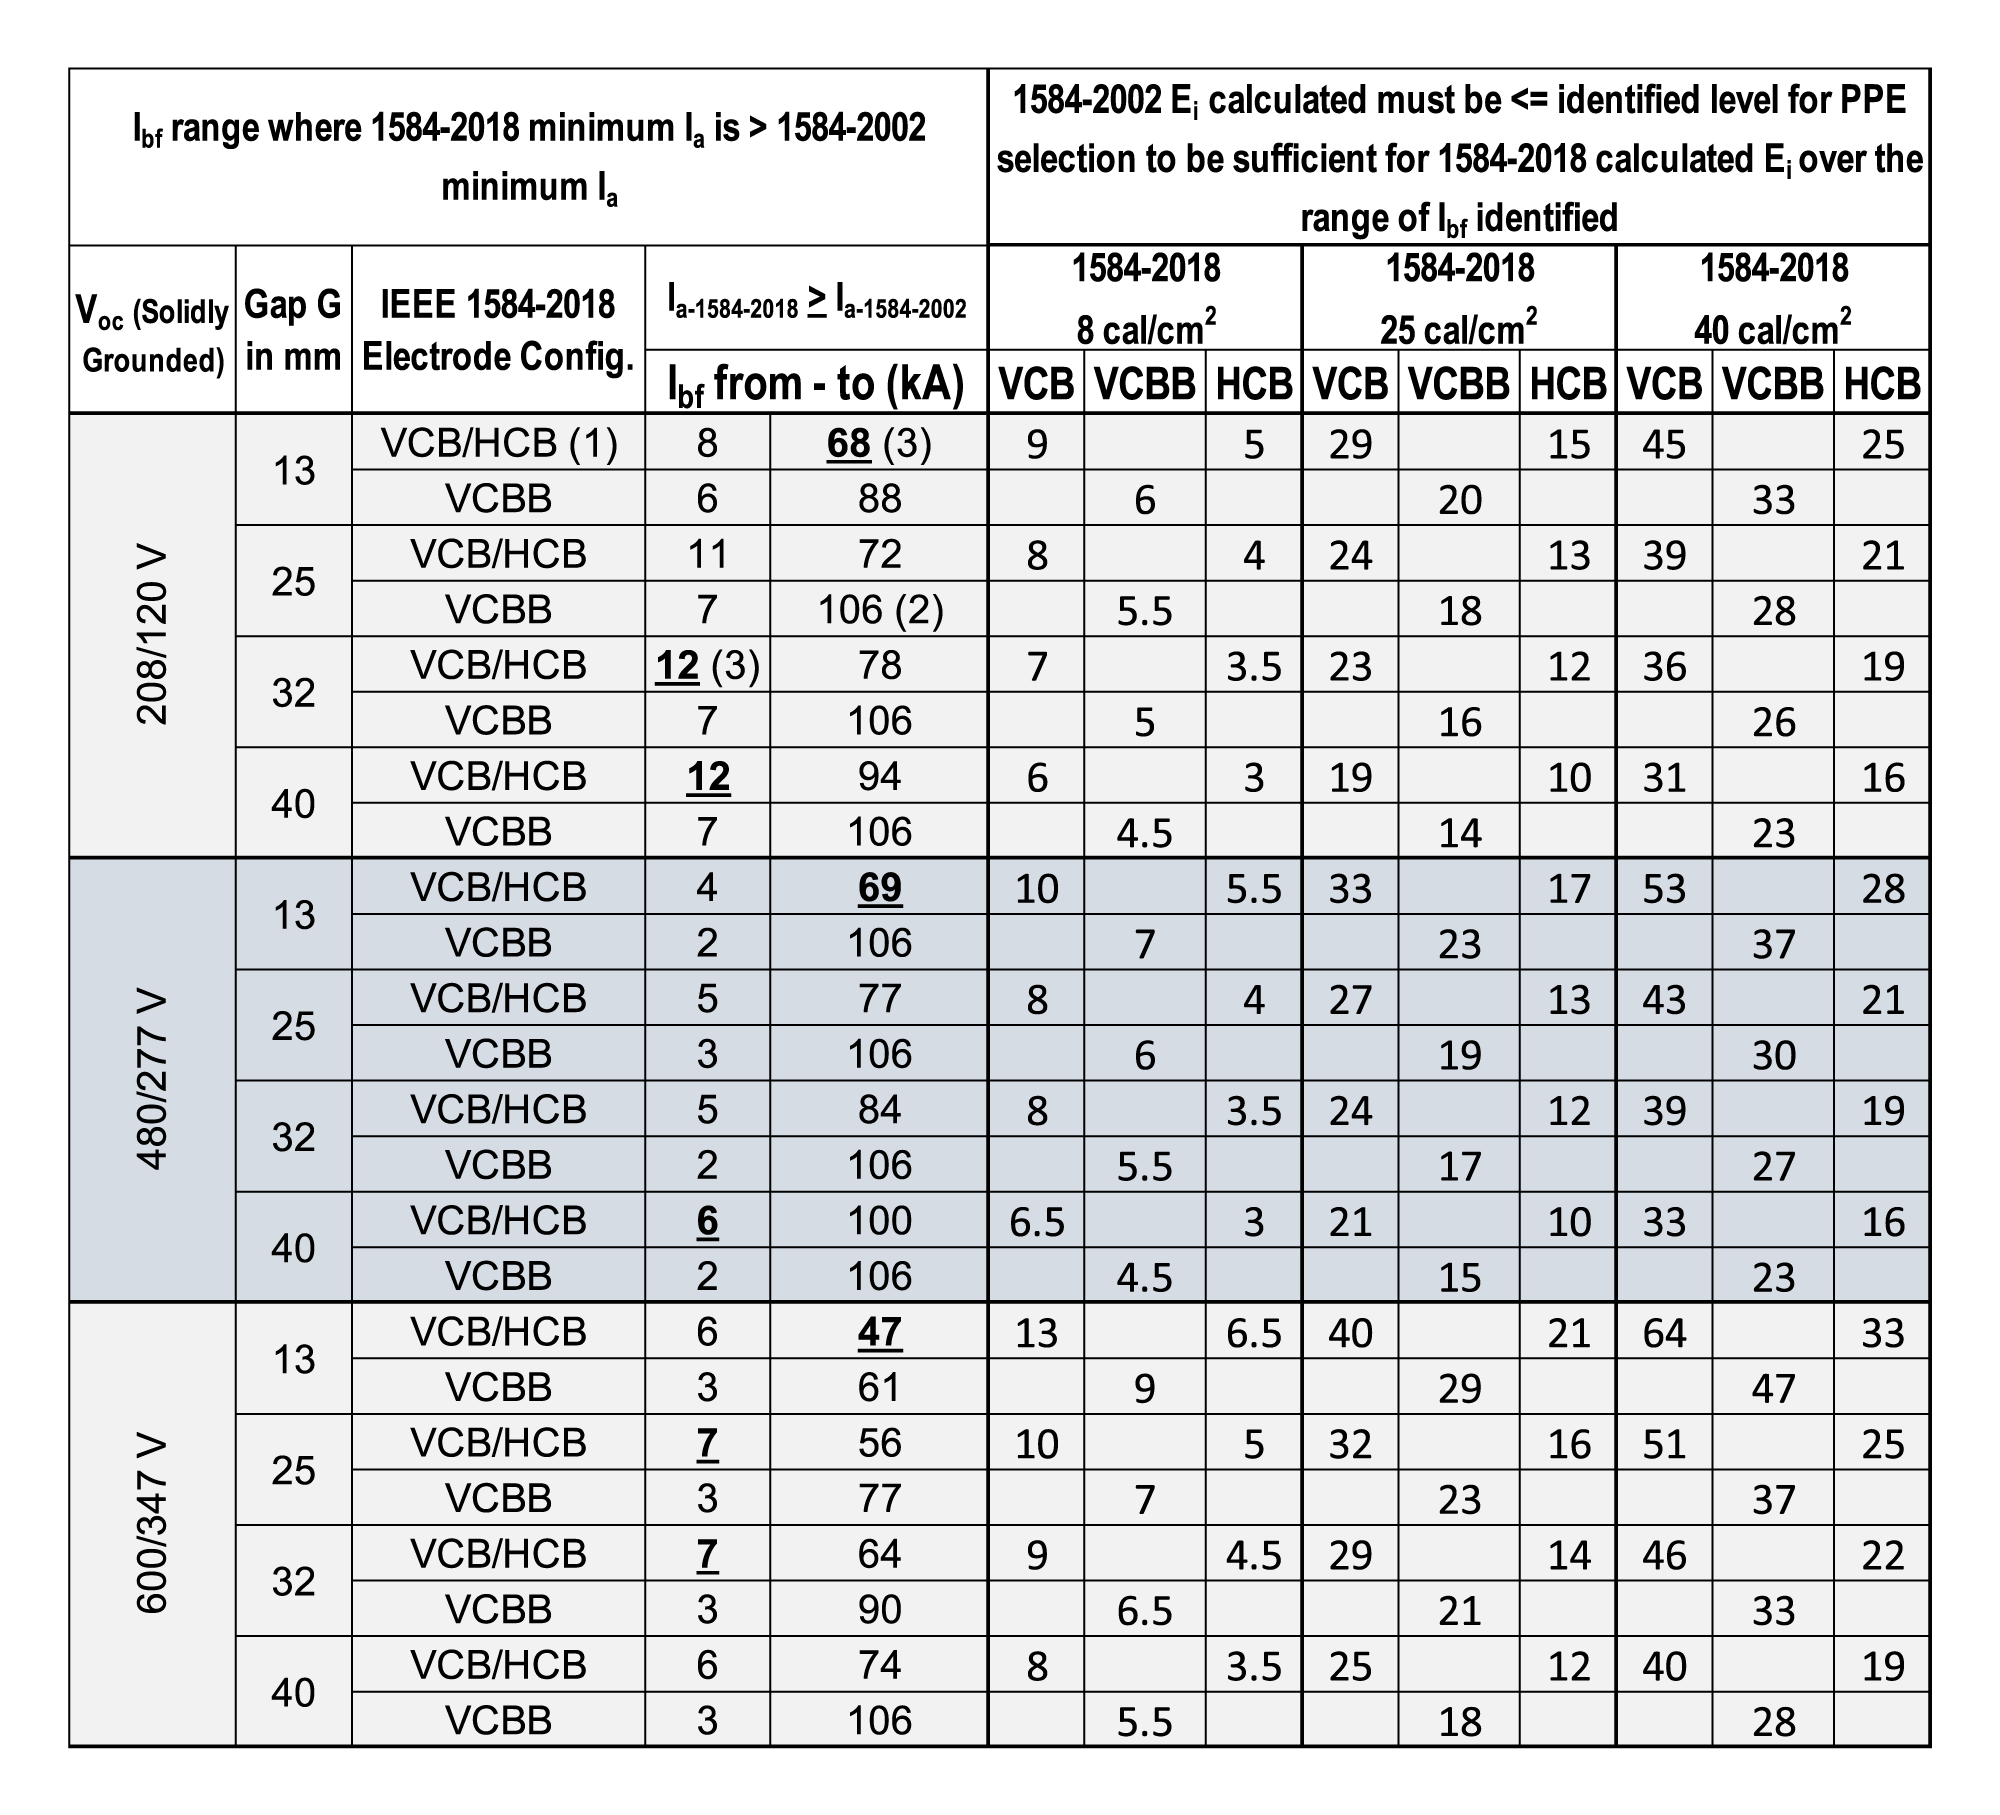
Figure 9: Incident Energy for VCB, VCBB, and HCB
If Ei calculated was 6 cal/cm2 but 8 PPE was selected. A task that may now have VCB or VCBB exposure is still covered by the 8 cal/cm2 PPE. For HCB, for some Ibf range, Ei may exceed PPE selected... A more exact calculation will be needed to make sure!
If Ei calculated was 5 cal/cm2 & 8 caI PPE was selected. HCB energy may not exceed selected PPE!
If Ei calculated was 5 cal/cm2 & 8 call PPE was selected. HCB energy may not exceed selected PPE!
Without Iarc or understanding the OCPD the method allows determination if a new electrode exposure presents unacceptable risk using only the 2002 based study!.... But one needs a chart to represent the specific scenario!
Figure 10: Assessing Risk with a Few Variables Is Possible
The results of plotting graphs for a series of comparative scenarios are summarized in the following tables.
HRG/Floating Systems
Calories/cm2 from 2002 study for HRG or ungrounded system. If PPE is = or higher rated than the arc rating identified at column top for identified conditions, then PPE should have higher arc rating than what a 2018 study would predict for the same identified conditions. Which include the same arcing gap, 18 inches working distance, standard box and electrode configuration of VCB in 2002 AF study and as identified in the column heading for the 2018 AF study.
Solidly Grounded Systems
Calories/cm2 from 2002 study for solidly grounded system. If PPE is = or > rated than the arc rating identified at column top for identified conditions then PPE should have higher arc rating than what a 2018 study would predict for the same identified conditions. Which include the same arcing gap, 18 inches working distance, standard box & electrode configuration of VCB in 2002 AF study & as identified in the column heading for the 2018 AF study.

Notes

≥2.7kV 1584-2018 always yields lower Ia 

  1. VCB & HCB have similar Ia so they are grouped in this table. 
  2. Ia not calculated for > 106 kA Ibf
  3. Bolded numbers are the highest minimum & lowest maximum in the voltage range
The method outlined in this presentation was solely created by M. E. Valdes and is not a product of the ABB company nor is it endorsed or promoted by ABB in any way. The method is not intended to replace a well performed arc flash study by qualified personnel using the latest applicable standards and generally accepted practices.

The method is solely intended to provide an estimating tool that may be useful in the process of risk analyses associated with evaluating if PPE has a high enough arc rating, under certain identified limited conditions, to exceed the incident energy that may be calculated by an Arc Flash study performed using IEEE 1584-2018 under the same identified limited conditions.

Additional Resources

Webinar Executive Summary
This presentation provides a methodology that could be used to assess previous PPE selections as suitable or not suitable.

View Executive Summary
Webinar Presentation

This presentation is a based on a paper presented at the IEEE 2020 Electrical Safety Workshop in March 2020.


View Webinar Slides
ABB’s Solutions for Arc Flash Protection & Remediation
ABB delivers multiple products and services that reduce exposure in both new and existing facilities.
View Web Portal